
98% of your website visitors leave without buying a ticket. Your platform is losing them.
WSO changes that.
Running inside real theaters from Los Angeles, San Francisco, Phoenix, to Washington DC.
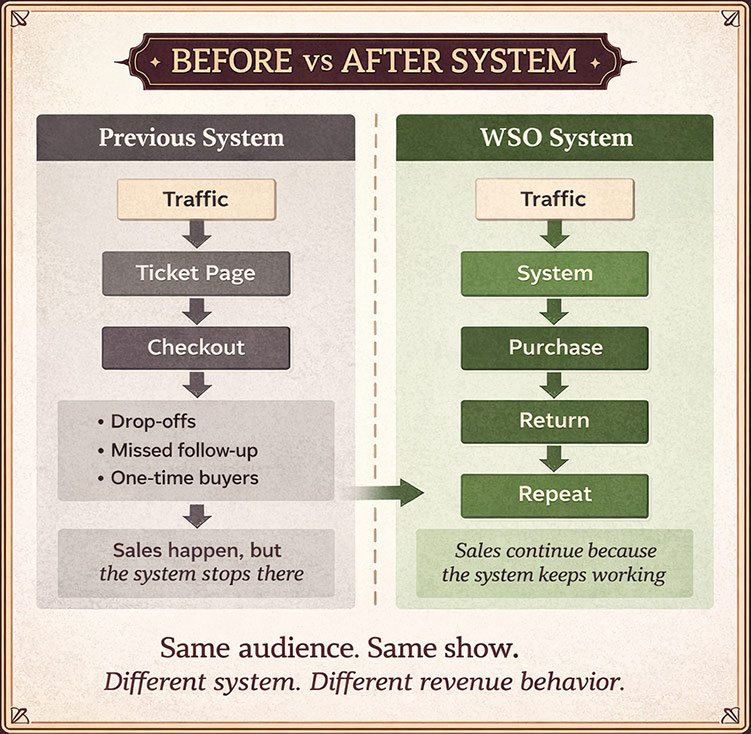
Most ticketing platforms were built to process orders. Not to grow a business.
Where the Money is Lost
Most buyers who leave didn’t all decide against it. They just didn’t finish.
They hesitate.
They return.
They compare.
They get pulled away.
Most ticketing platforms only record the final purchase.
WSO controls what happens before that decision is lost.
When the system changes:
• More visitors complete the purchase
• Interrupted buyers return and finish
• Past buyers come back again
• Revenue stabilizes instead of swinging
Nothing new to manage.
Nothing extra to run.
The system starts doing what your ticketing platform was never designed to do.
Who This Is For
Built for established theaters with real demand.
Not early-stage shows.
Not hobby operations.
Not generic high-volume ticket processing.
WSO is for operators who already have traffic, sales, and reputation, but suspect the system underneath is limiting what the theater earns.
If you have been through this before and came away with nothing, that experience is exactly why this conversation is different.
What Happens When the System Changes
These results came from live theaters. Different markets. The same outcome.
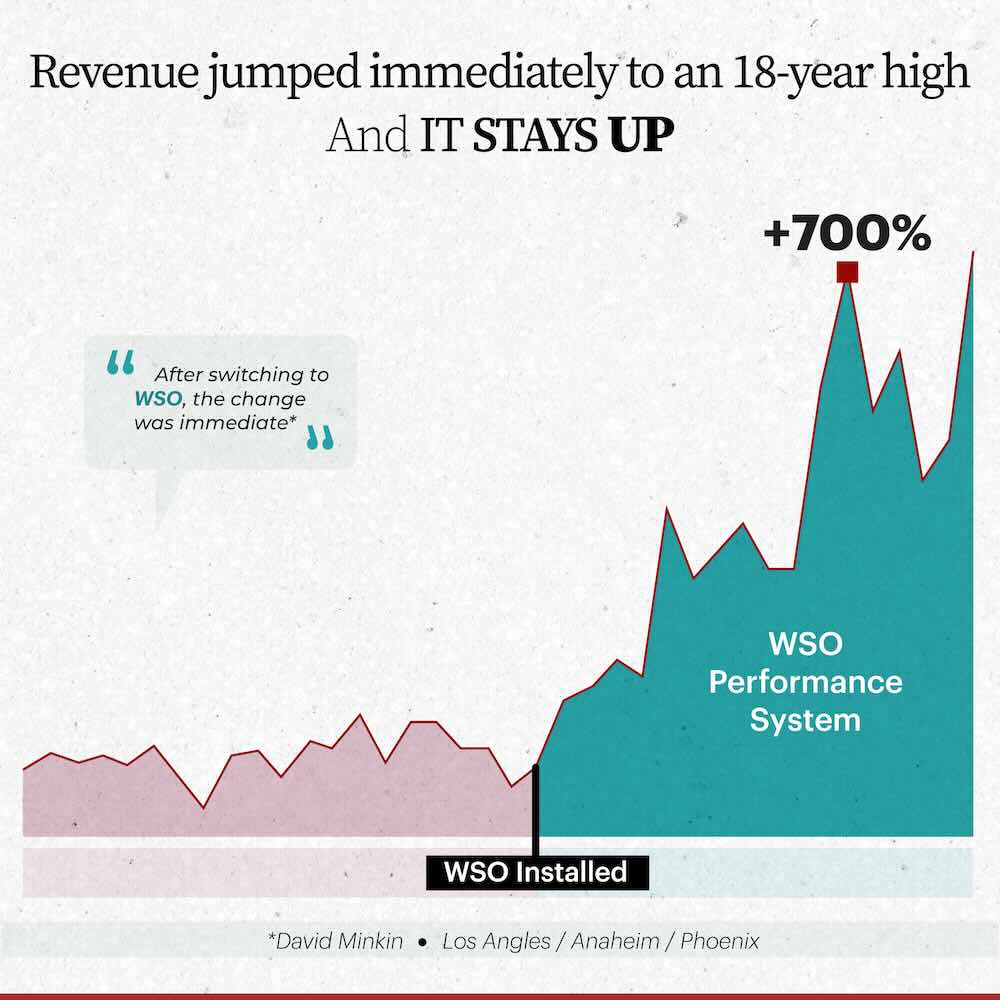
In one theater, revenue increased 700% within 12 months.
The audience didn’t change. The system did. Once the structure changed, the outcome followed.
This is Not a One-Off
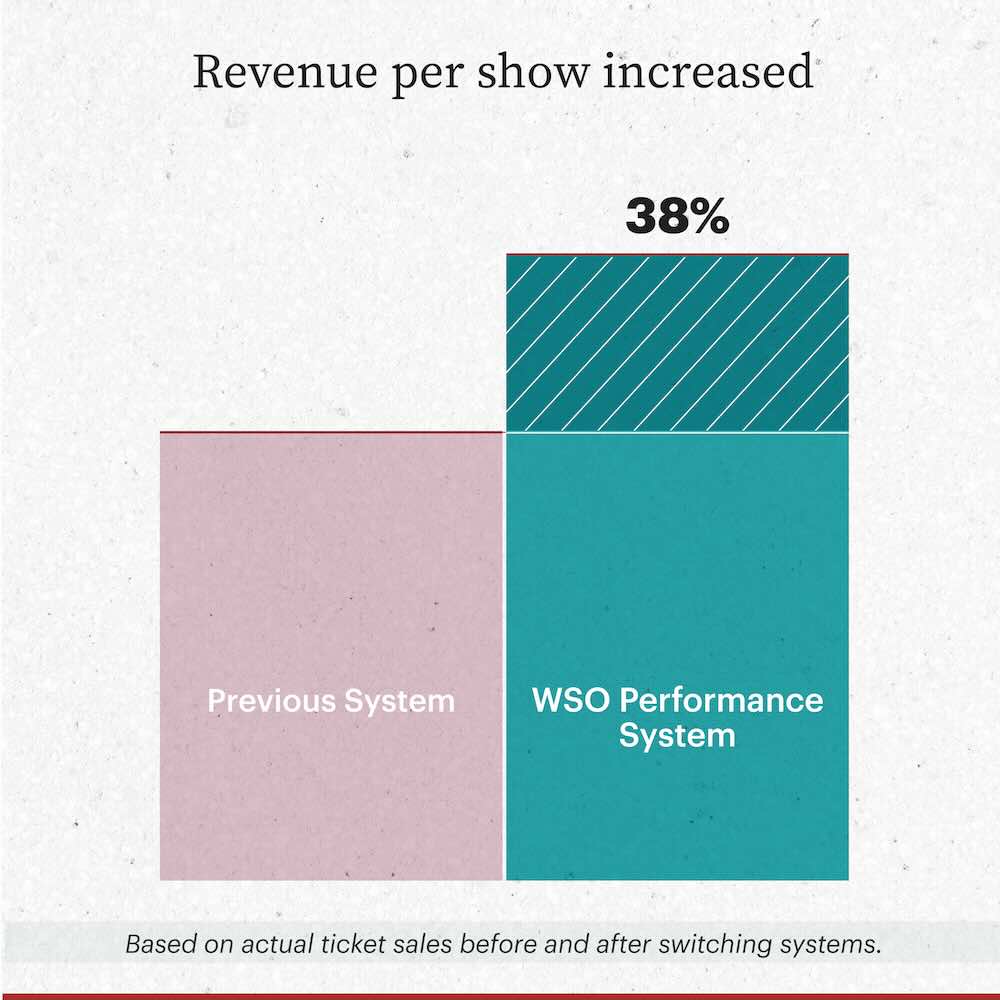
In another theater, revenue per show increased 38%.
The demand didn’t change. The structure changed. More buyers completed.
Where the Difference Shows Up
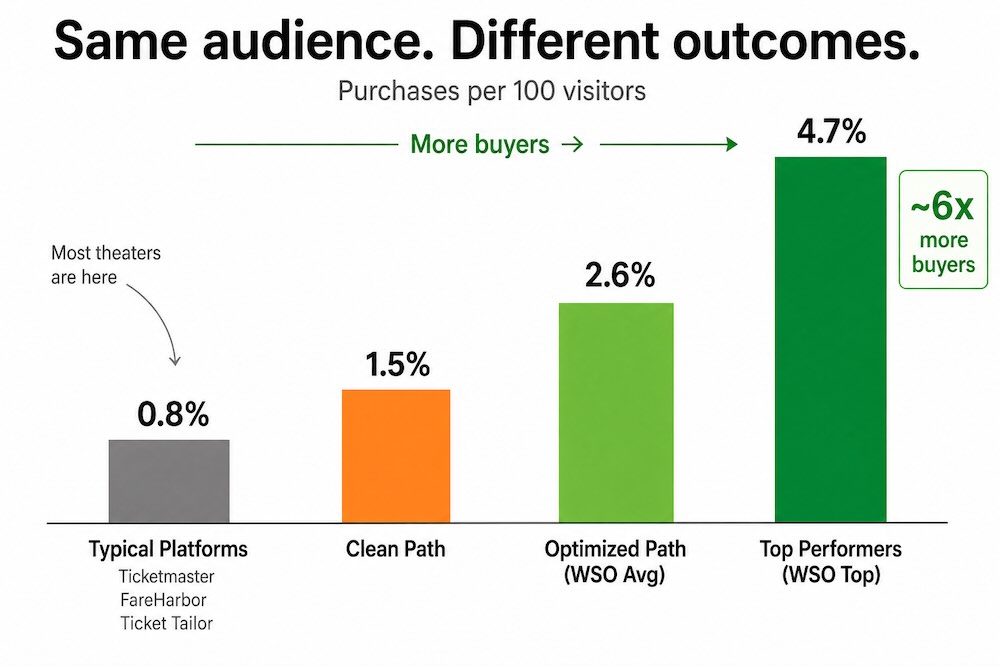
What That Difference Costs You
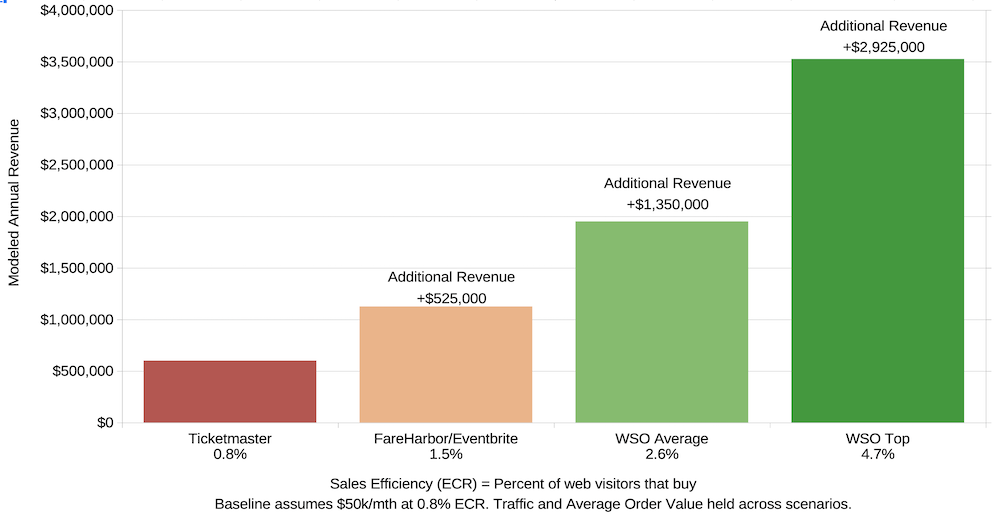
More visitors complete the purchase. Revenue builds from that difference.
Built with a former Motorola satellite systems engineer, WSO was designed to control how buying decisions form, complete, and return.
We work with one theater per market.
Strategy stays focused. Performance stays protected.
The Numbers Don't Lie
These are live theaters. The environments differ. The pattern doesn't.
See This On Your Theater
We'll show exactly where buyers are dropping out and what it's costing you.
No prep needed. Takes a few minutes.
Data verified from live WSO theaters. Figures are verified from tracked ticket sales and reviewed quarterly for accuracy. Results vary by market and execution.