
Your show is filling.
Your system may be costing you anyway.
What we see inside live theaters that most operators never look for.
Most operators track revenue. Very few track where it's being lost before it arrives.
What Most Operators Miss
A full room feels like proof the system is working.
It isn't. A full room means demand showed up. It says nothing about how much of that demand actually turned into revenue, how many buyers started and didn't finish, or how many left and never came back.
Most platforms only record the sale. Everything that happened before it stays invisible.
What We Actually See
Across live theaters in multiple markets, the same pattern repeats.
Demand did not disappear. Buyer certainty did.
Buyers were interested. They visited. They looked at dates. They started to buy. Then something interrupted them and the platform let them walk.
The theaters that held revenue through uncertain periods were not the ones with more traffic or bigger marketing budgets. They were the ones whose systems didn't let buyers slip through.
Where Most Theaters Actually Land
Most theaters fall into the same range regardless of size, reputation, or how full the room feels. Very few operators know which range they're in until they see the data.
The chart below shows where most theaters actually land.
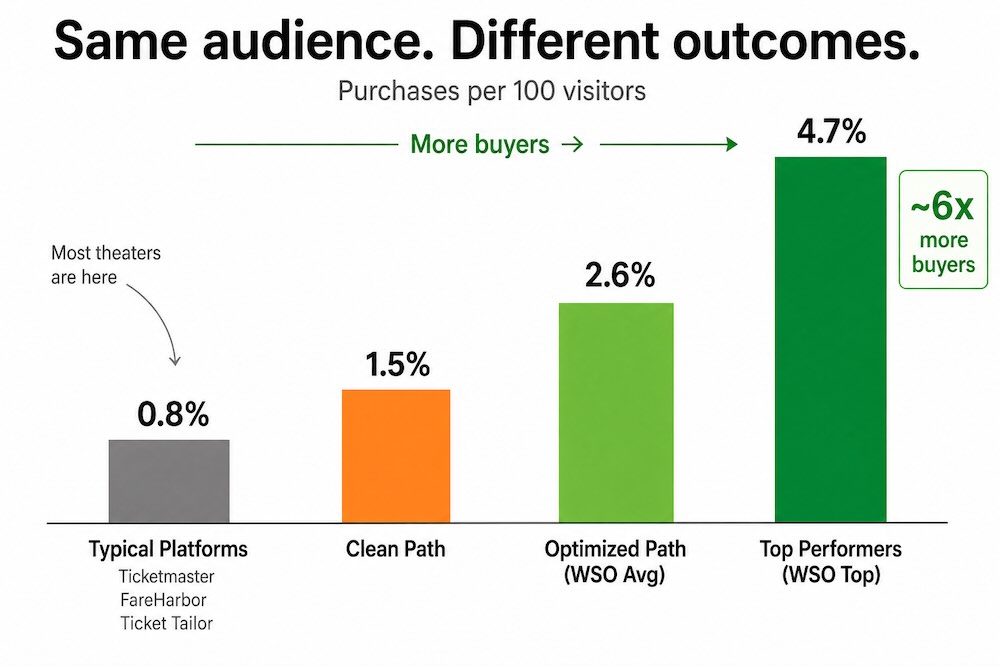
Small efficiency differences produced large revenue divergence under identical demand.
Small gains at each stage compound. The layers build on each other.
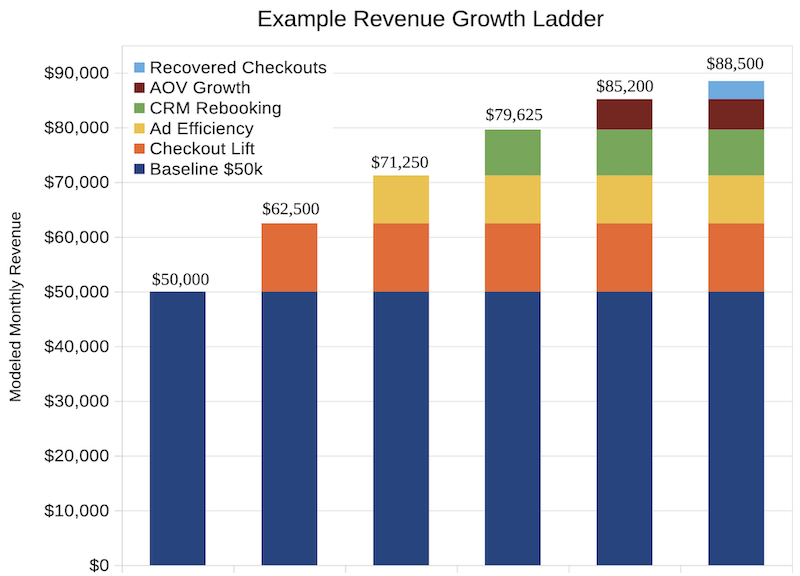
Dollar values are normalized to show relative impact, not to represent any single theater.
What Separated the Theaters That Held
- More buyers completed the purchase before leaving
- Interrupted buyers were brought back automatically
- Past buyers returned without being chased
- Revenue stabilized instead of swinging with the market
None of it required more marketing. It required a system that didn't stop working when the buyer paused.
The Market Did Not Become Unpredictable.
It became less forgiving.
Platforms that were never designed to grow revenue kept enforcing the same ceiling. The theaters that changed the system underneath stopped hitting it.
That number already exists in your theater right now. Most operators only discover it after performance stalls.
See What the Pattern Looks Like in Practice
These theaters changed the system. The revenue followed.
The Evidence
Find Out What Your System Is Actually Doing
We'll show exactly where buyers are dropping out and what it's costing you.
No prep needed. Takes a few minutes.
Data verified from live WSO theaters. Figures are verified from tracked ticket sales and reviewed quarterly for accuracy. Results vary by market and execution, but efficiency always compounds.