
38% higher revenue per show once the full system was working.
The system changed. The revenue followed.
The show was already running.
Tickets were already selling.
Revenue looked normal.
Revenue was happening. What was driving it and what was limiting it were both invisible.
The Magic Duel Effect
The Magic Duel is a long-running Washington, D.C. production operating at sustained scale.
Ticket sales were happening. The constraint was hidden.
Buyer completion more than doubled.
Revenue per show increased 38%.
The system made both possible.
Producer's Perspective
The show was proven. The system was not.

"WSO boosted our ticket sales fast. But what changed everything was finally seeing where my sales were coming from."
Mark Phillips, Producer, The Magic Duel
More Revenue Per Show
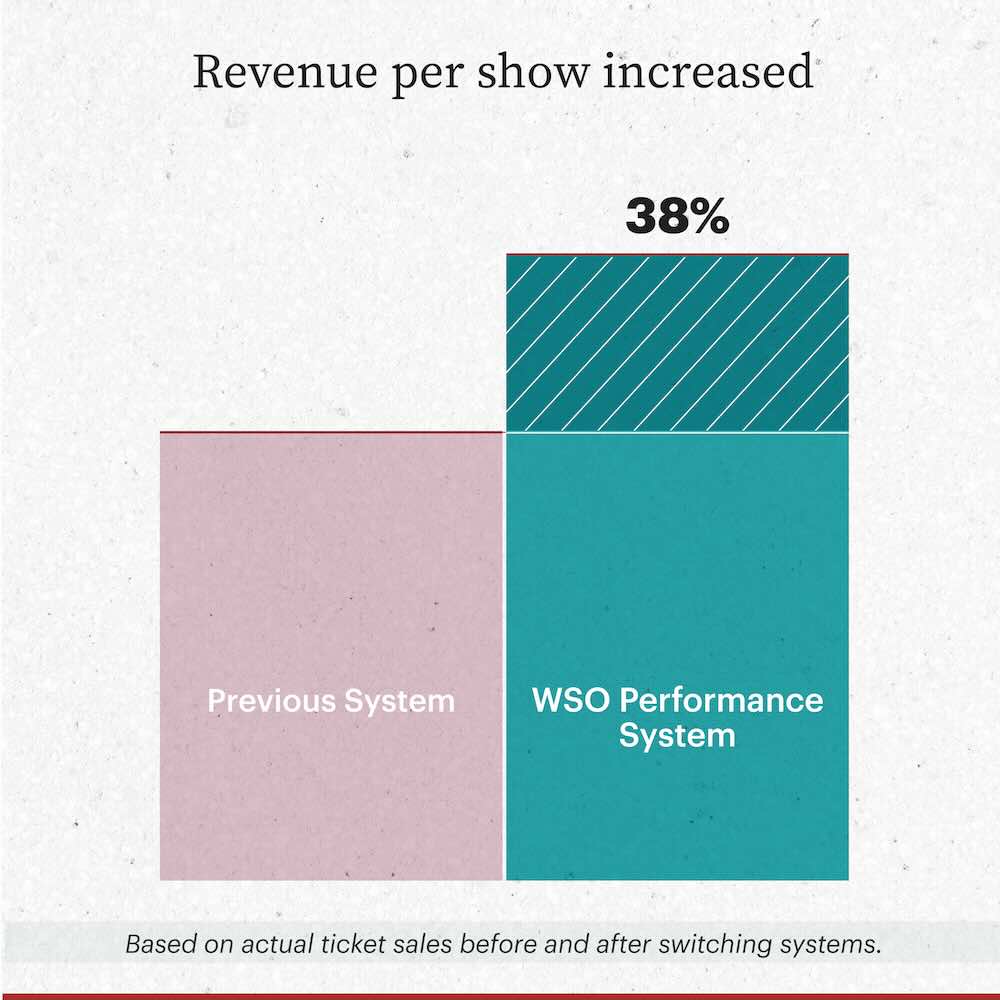
Revenue per show increased 38%. Same audience. Same show. The system made the difference.
More Buyers Per Show
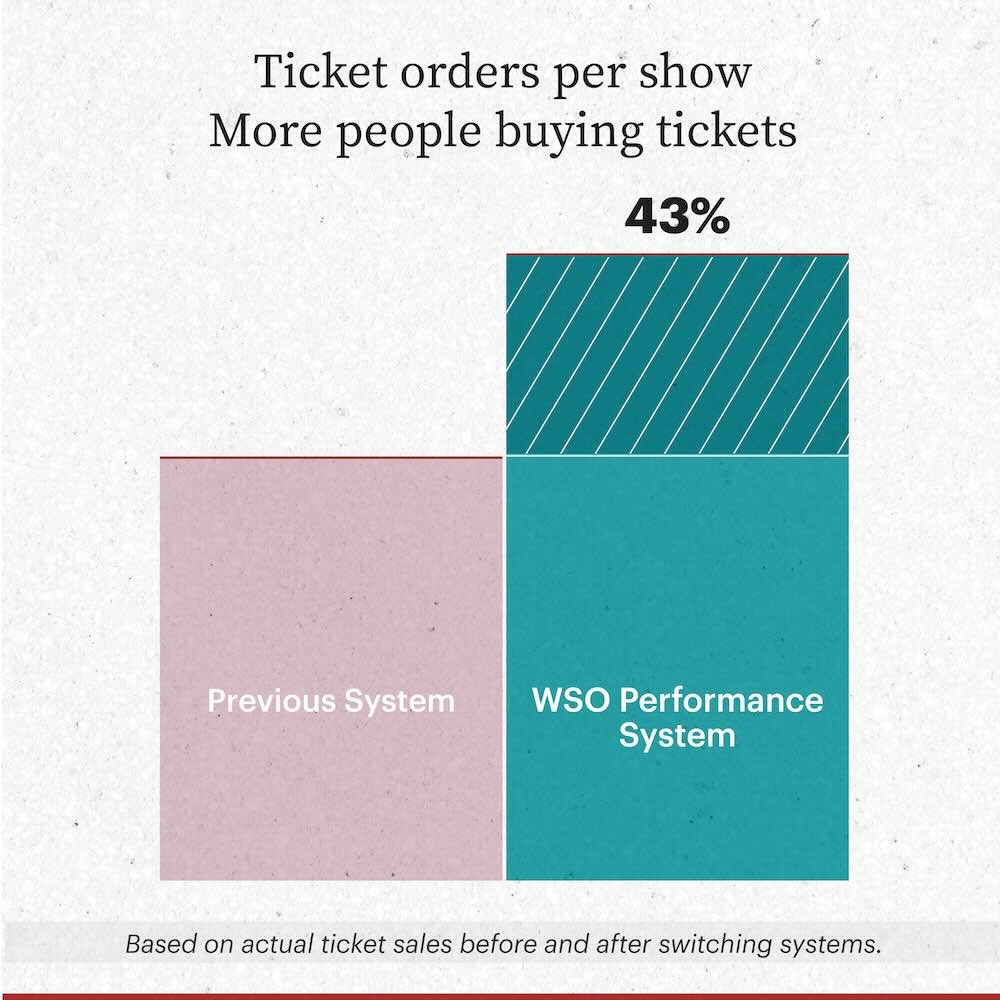
Ticket orders per show increased 43%. More buyers completing the purchase from the same traffic.
What Changed
The old system sold tickets and stopped there.
WSO brought traffic, conversion, tracking, and recovery together as one system.
When every layer worked together, the revenue reflected that.
Sales Unlocked
Buyer completion more than doubled. Revenue per show followed.
Where the Boost Came From
Every layer of the system working together. Not one fix. One system.
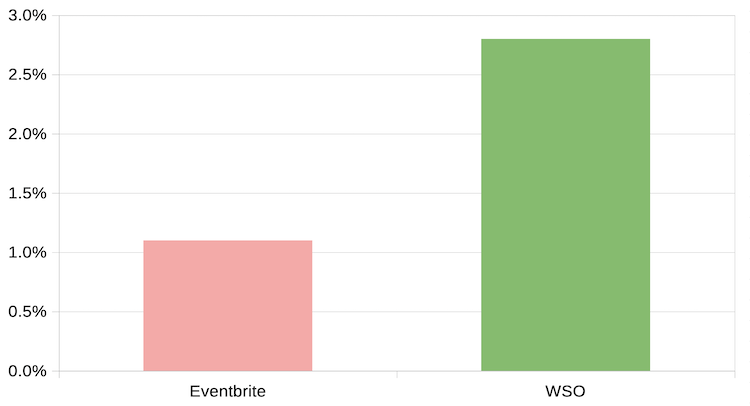
Sales Efficiency: Industry vs. WSO
The System
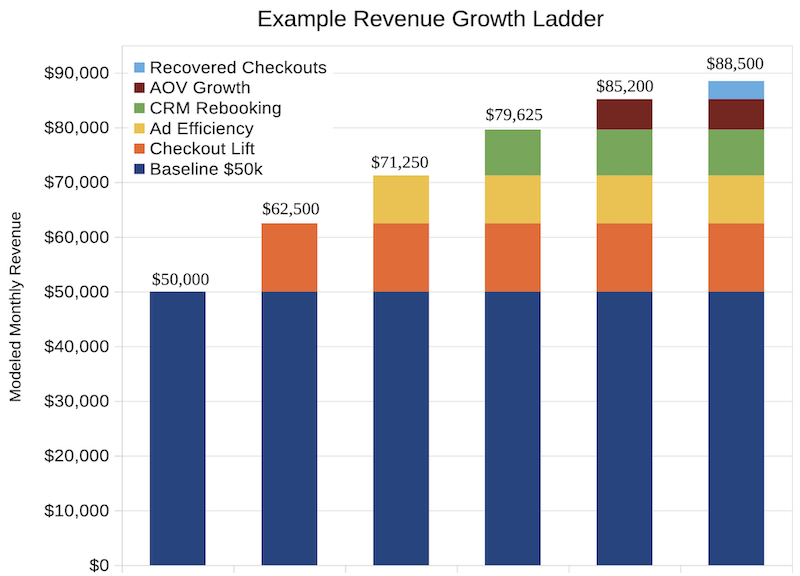
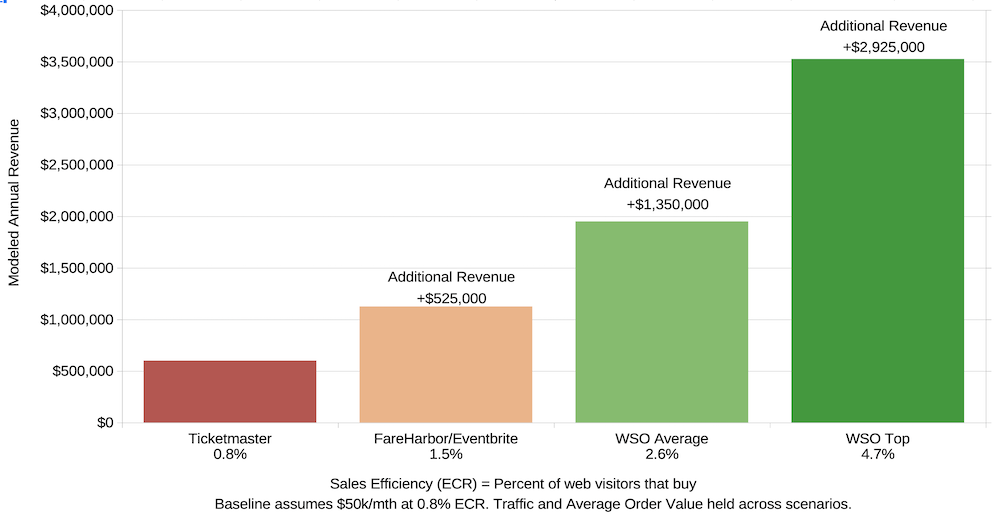
Values modeled from verified WSO performance data. Each layer of the system adds lift. Together, they multiply revenue. The change doesn’t come from one improvement. It comes from how the system works as a whole.
The Pattern Is Consistent
Different markets. Different shows. The same structural gap.
See This On Your Theater
We'll show exactly where buyers are dropping out and what it's costing you.
No prep needed. Takes a few minutes.
Data verified from live WSO theaters. Figures are verified from tracked ticket sales and reviewed quarterly for accuracy. Results vary by market and execution.