
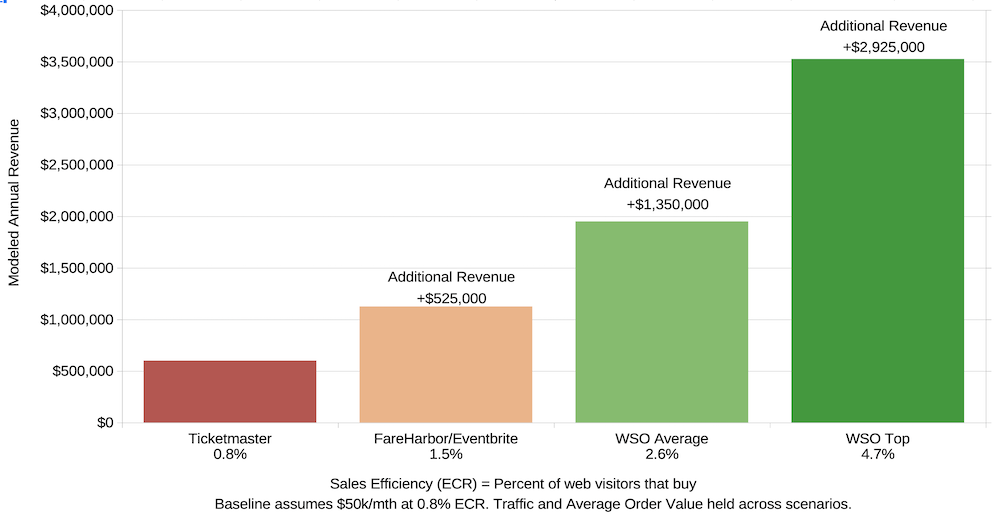
At 4.7% Sales Efficiency, the system stopped limiting what the show could earn.
Demand was already there. The platform was the constraint.
The shows were running.
The audience was consistent.
Revenue was stable.
Strong demand still leaves money behind when the platform stops short.
What Changed
San Francisco Magic Theater already had demand and a strong show.
What changed was the system sitting behind it, starting with how many visitors completed the decision.
Early Impact
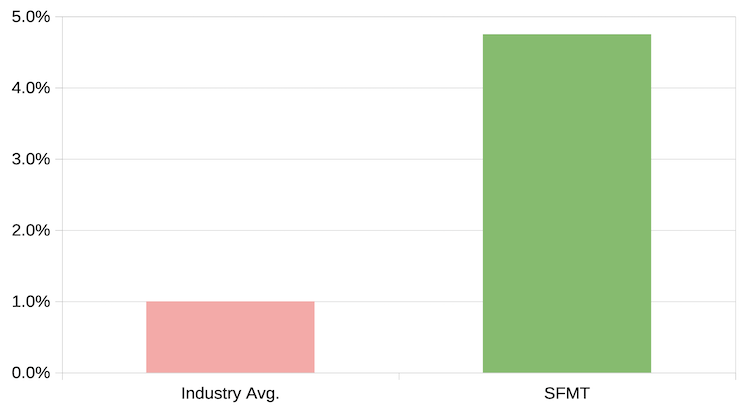
4.7% buyer completion.
Revenue increased while traffic remained stable.
What Drove the Shift
The show did not need more marketing.
It needed a system that did not interrupt the buying decision.
Once that changed, more buyers completed the purchase.
Sales Unlocked
Buyer completion increased. Costs became more efficient. The system began working as a whole.
Traffic did not increase. More visitors completed the purchase.
Headroom
Not a platform. Not a tool. A system with people behind it who know what they are doing.
Producer’s Perspective
The show was strong. WSO made it possible to see exactly how strong.

"WSO isn’t just a tool. It’s like having a team of marketers, techs, and problem solvers on speed dial who genuinely want to see you win."
Jay Alexander, Producer, San Francisco Magic Theater
Sales Efficiency: Industry vs. WSO
The System
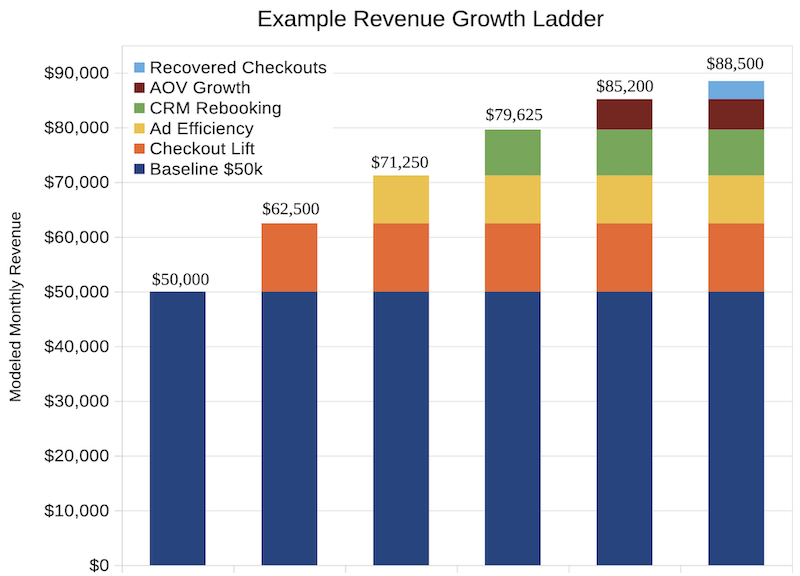
Values modeled from verified WSO performance data. The change doesn’t come from one improvement. It comes from how the layers work together.
Ready to Know?
Every theater we work with thought their platform was fine.
Find out what my theater is leaving behind
See This On Your Theater
We'll show exactly where buyers are dropping out and what it's costing you.
No prep needed. Takes a few minutes.
Data verified from live WSO theaters. Figures are verified from tracked ticket sales and reviewed quarterly for accuracy. Results vary by market and execution.