
Over 700% revenue growth
What happens when every part of the system works together.
The show was already running.
The audience was already there.
Sales were already happening.
WSO brought every layer of the system to bear. The result speaks for itself.
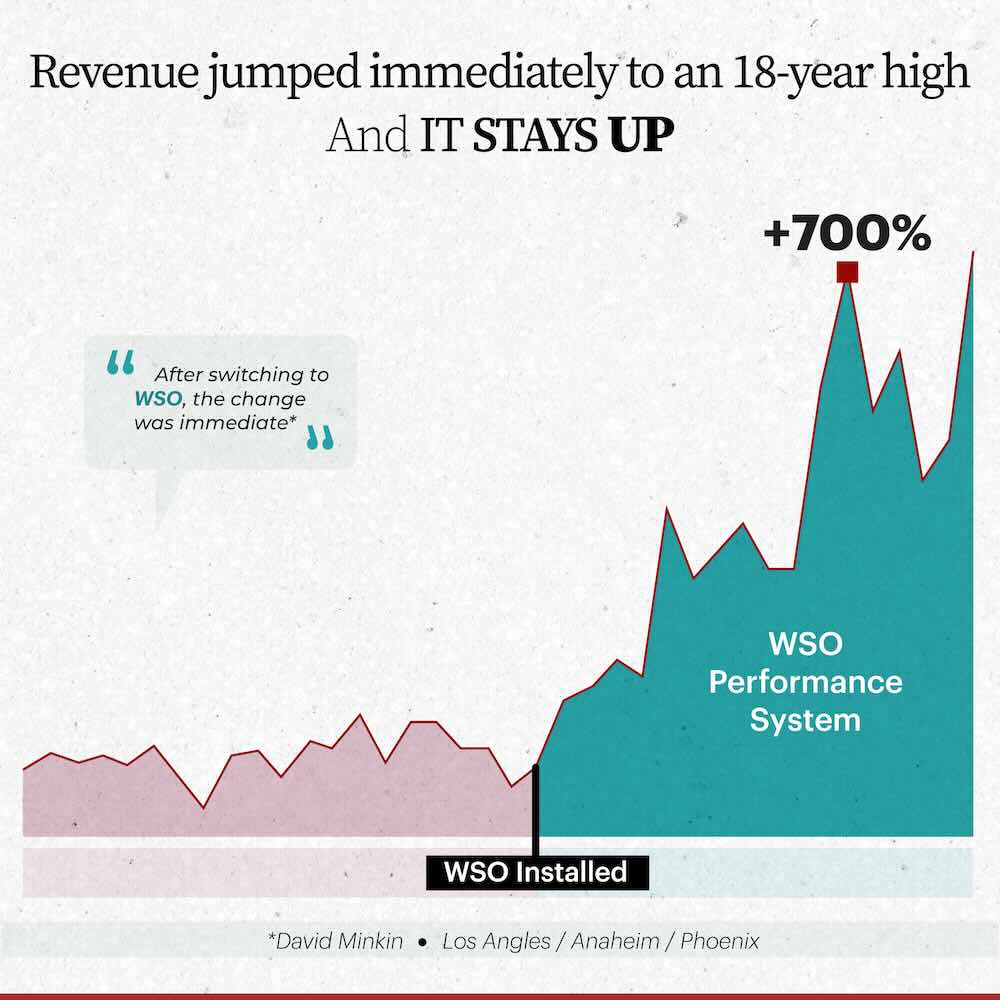
Over 700% revenue increase within twelve months. This was not a short-term spike. The revenue moved into a new range and stayed there.
This Was Not One Thing
Better traffic. Smarter ads. A growing list.
Every layer optimized. All of it working together.
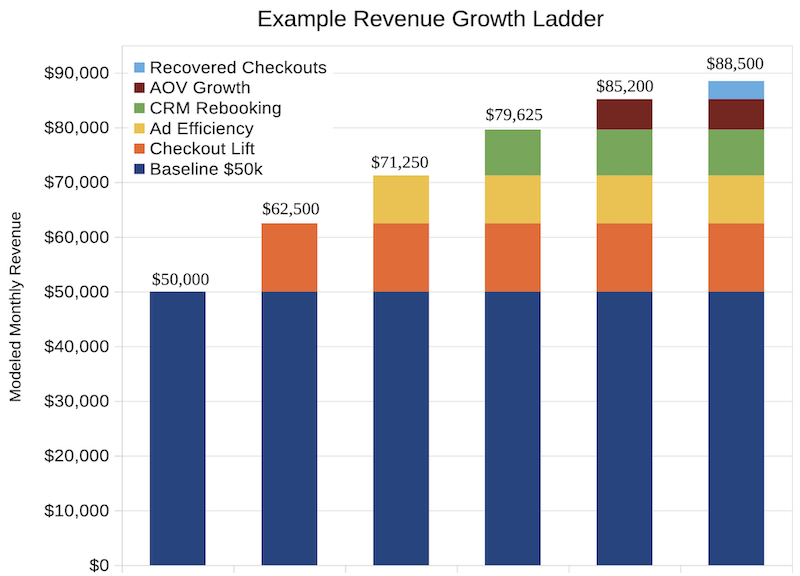
How the System Works
Buyer completion first. Then traffic, ads, list building, and tracking. Each layer builds on the one before it. When all of it runs together, the revenue reflects that.
David Minkin In His Own Words
Producer’s Perspective
Every part of the system working together produced something none of the parts could produce alone.

"After switching to WSO, I broke my 18-year gross ticket sales record... TWICE... in two months."
David Minkin, Producer, Los Angeles
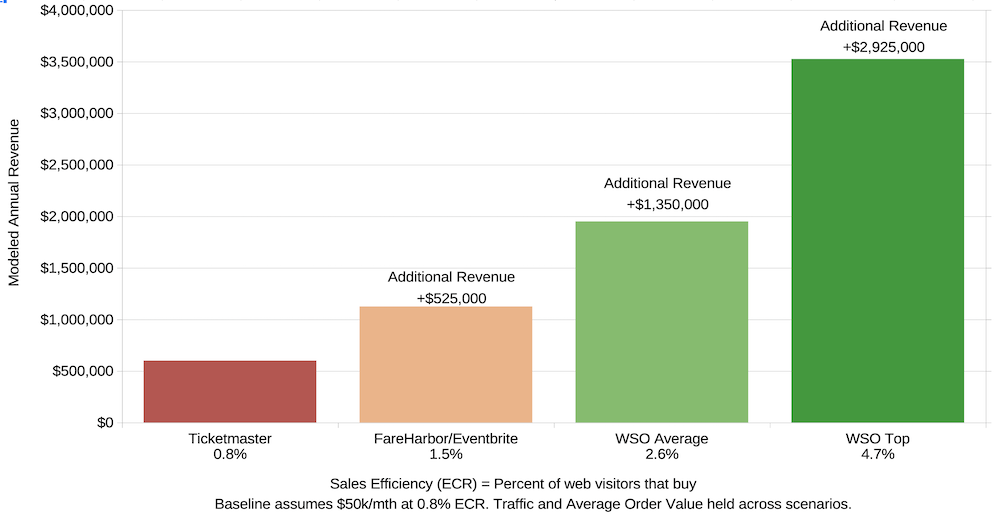
Sales Efficiency: Industry vs. WSO
The System
Values modeled from verified WSO performance data. The change doesn’t come from one improvement. It comes from how the layers work together.
This Is Not a One-Off
The same pattern holds in a completely different market.
See This On Your Theater
We'll show exactly where buyers are dropping out and what it's costing you.
No prep needed. Takes a few minutes.
Data verified from live WSO theaters. Figures are verified from tracked ticket sales and reviewed quarterly for accuracy. Results vary by market and execution.