
Revenue Growth Systems for Live Entertainment
Similar shows. Very different results.
The difference isn’t demand. It’s the system.
This isn't marketing theory. These are patterns observed across real theaters once their buying path became fully visible.
Same audience. Same demand.
Different outcomes.
When demand is steady, the difference shows up between “I want to go” and “I bought.”
That gap doesn’t happen at the box office.
It happens earlier.
What Your System Actually Shows You
Most ticketing systems only report the ending:
Tickets sold.
Revenue collected.
They don’t show:
• Where hesitation starts
• Where momentum breaks
• Where buyers quietly disappear
By the time revenue is visible, the decision is already over.
You just never saw it happen.
Where Revenue Is Being Prevented
When buyers don’t complete, revenue isn’t “missed.”
It’s prevented.
Not by lack of interest. By friction that compounds quietly, month after month.
If you can’t see where completion drops, a ceiling starts to feel normal.
Why Plateaus Feel Unexplainable
Sales rarely fall apart at checkout.
They slip earlier, when the path feels slower, unclear, or slightly off.
If you can’t see where that drop begins, nothing looks wrong.
Sales Efficiency Is Not Evenly Distributed
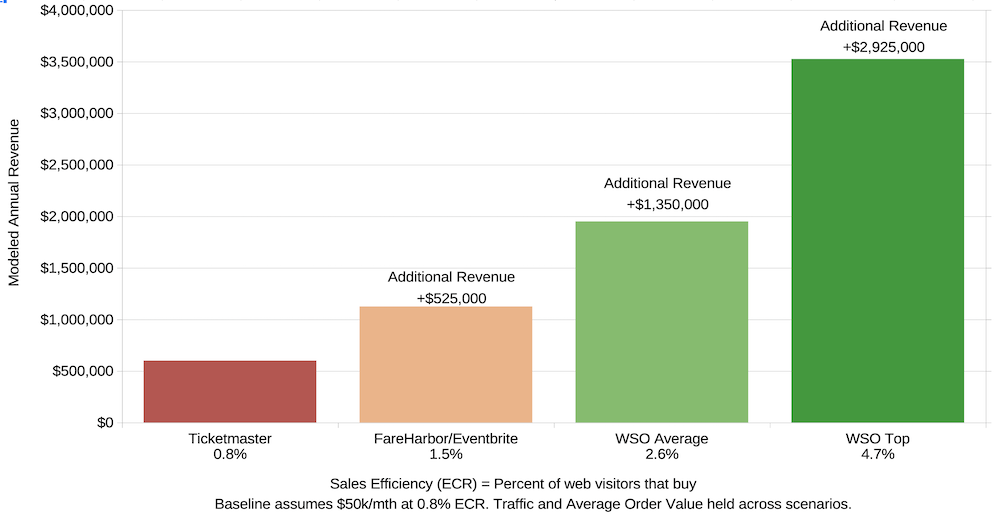
Separation begins the moment your system stops hiding the number.
Your system is losing buyers quietly along the way.
Often it isn’t demand holding performance back.
It’s visitors lost through small, compounding inefficiencies before checkout.
The Cost of Waiting
Most theaters don’t fail.
They stall.
Revenue holds steady.
Ads get more expensive.
Margins quietly compress.
The dangerous part?
Nothing looks broken.
But efficiency gaps don’t stay flat. They compound.
Every month on an inefficient system:
• More demand disappears before checkout
• More abandoned buyers are lost permanently
• More behavioral data benefits competitors who already removed friction earlier
Leaders don’t pull ahead by moving faster.
They pull ahead by fixing structural inefficiency first.
Why the Gap Keeps Growing
Once friction is reduced, every improvement has more leverage.
Cleaner paths create more completed purchases. More completed purchases create clearer data. Clearer data makes each next decision easier to get right.
That’s how small advantages compound into lasting separation over time.
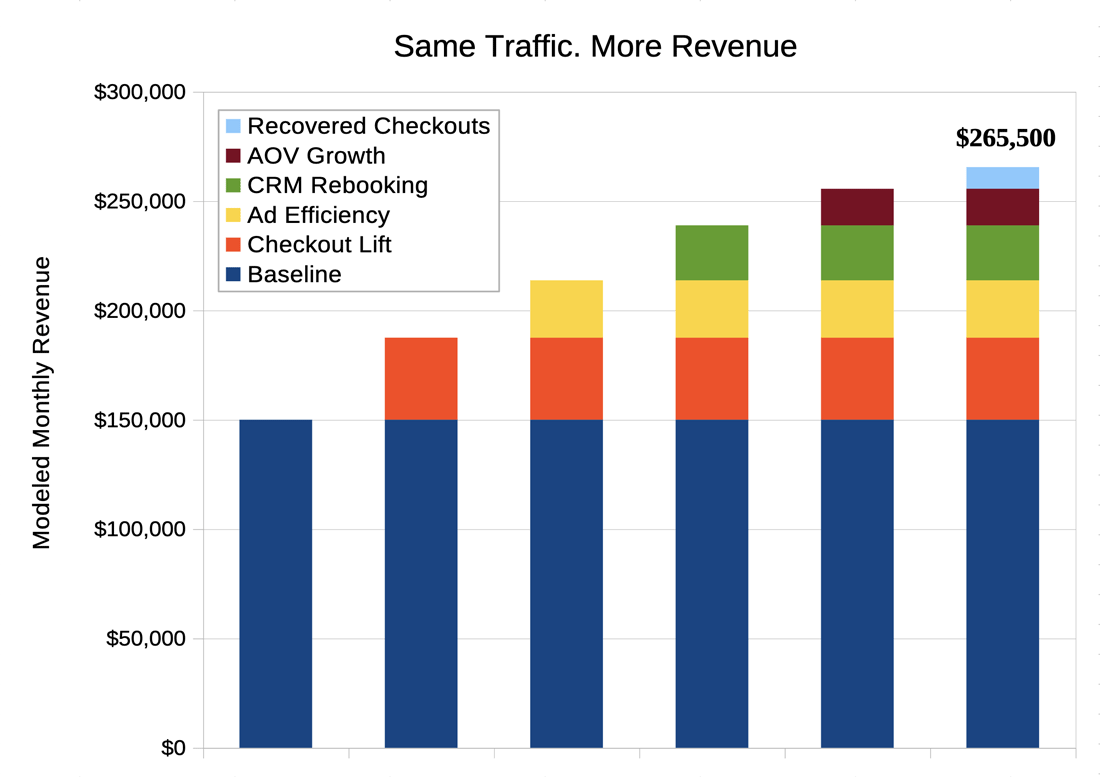
Every gain makes the next one bigger.
Standing still is not neutral.
See Where People Are Dropping Out
Most operators only discover this number after growth stalls, ads get expensive, or repeat buyers thin out.
You know your theater. Very few can see where buyers quietly leave along the way.
Spotlight shows you that drop-off. Not averages. Just what’s actually happening in your system.
If this catches you off guard, it usually explains why growth has felt heavier than it should.
This is what your system has already been deciding.
A diagnostic snapshot. Nothing changes until the number is visible.
What Changes Once the Number Is Visible
Friction is rarely where you think it is, because your platform never exposes it.
Same system. Different markets.
Different ceilings.
Also deployed in San Francisco and Washington DC.
This is not ticketing software.
It’s visibility into performance most systems never expose.
Everything else flows from that.
Once the gap is clear,Talk it Through.
Data verified from live WSO theaters. Figures are verified from tracked ticket sales and reviewed quarterly for accuracy. Results vary by market and execution, but efficiency always compounds.